PHM tool is model-based user interface which the user creates his system using various mechanical and electrical equipment’s, but can also calculates the reliability, failure rate and probability of task completion (POTC) of the created system. In addition, the PHM Tool offers the user the ability to formulate his own components and add them to the system. PHM Tool can also work with a real robot. Data from the sensors on the real robot are published via ROS topics. By subscribing to these topics in the PHM Tool, the system’s failure rate, reliability and POTC values are calculated together with the data which is obtained from the sensors.
NOTE: You can access our article “Prognostic & Health Management (PHM) Tool for Robot Operating System (ROS)” published as dissemination activity of this project from this link.
About the Prognostic and Health Management (PHM) Tool
Basically 2 different operations are performed in the PHM Tool:
- Robot Configuration
- System Analysis and Monitoring
Robot configuration operations are performed in “Robot Configuration Setup” tab. The flowchart of the operations performed on the “Robot Configuration Setup” tab is shown in Figure 1.
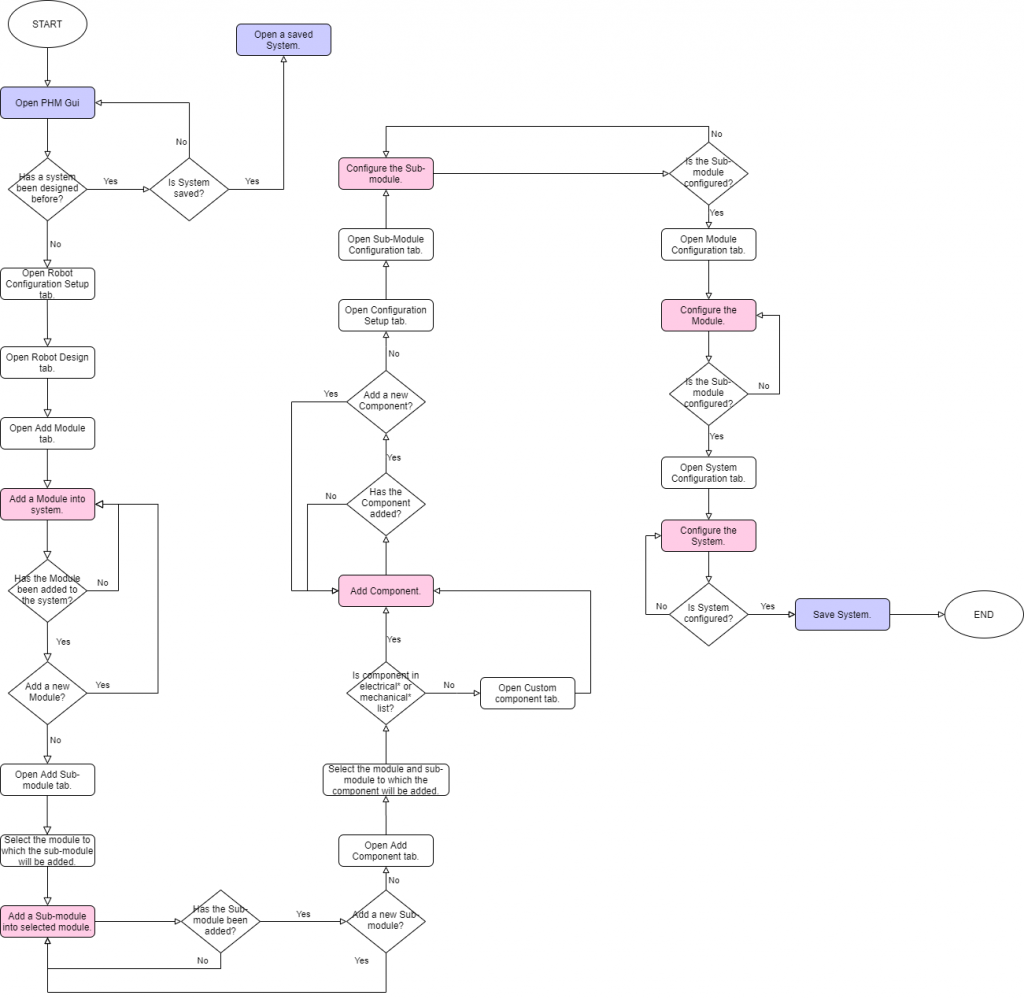 – Fig.1 Flowchart of the operations performed on the “Robot Configuration Setup” tab –
System analysis and monitoring operations are performed in “Monitoring and Analysis” tab. The flowchart of the operations performed on the “Monitoring and Analysis” tab is shown in Figure 2.
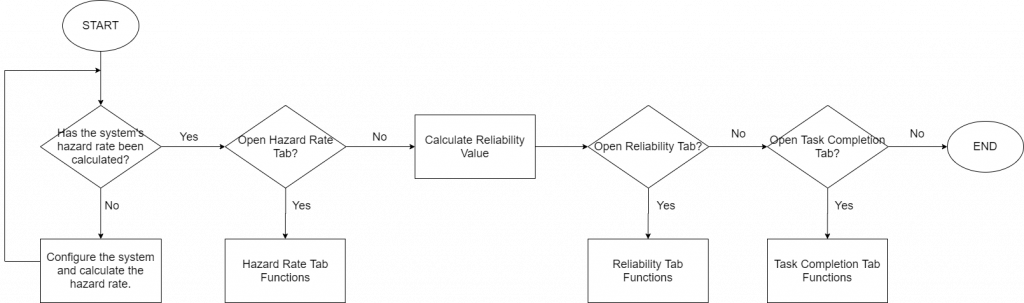
– Fig.2 Flowchart of the operations performed on the “Monitoring and Analysis” tab –
“Robot Configuration Setup” tab is the tab where the parts (modules, sub-modules, components) in the robot are added, created and configured.
In the “Monitoring and Analysis” tab, the configured system in the “Robot Configuration Setup” tab is presented to the user in real time by calculating the hazard rate, reliability and POTC values according to the specified reliability model and unit. In addition, sensors can be added and the results are shown in real time.
Since PHM Tool is a modular tool, the modules and submodules in the robotic system must be created at the interface. Therefore, these processes will be worked on the “Robot Design” tab (Figure 3).
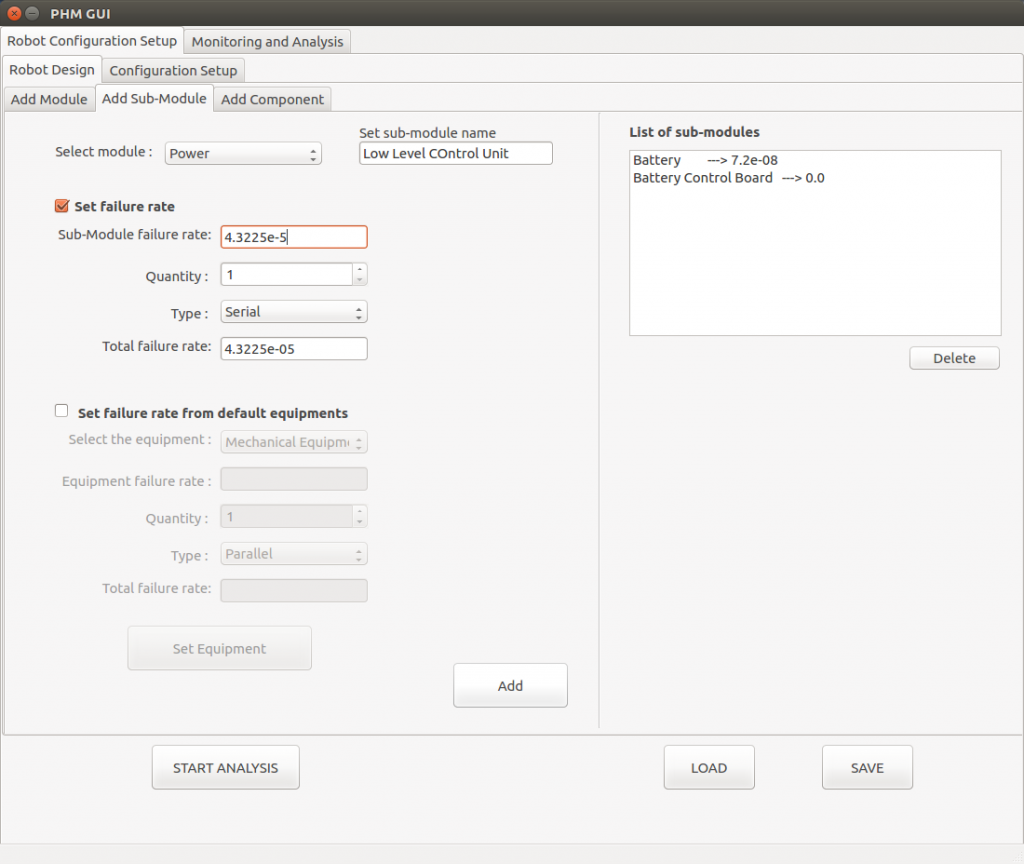
– Fig.3 Robot Design tab in PHM GUI-
The configuration of each component, sub-module and module is derived by defining their serial or parallel relationships with each other. In this way, the failure rate values of the sub-modules, modules and system are calculated. The configuration process will be run in the “Configuration Setup” tab (Figure 4).
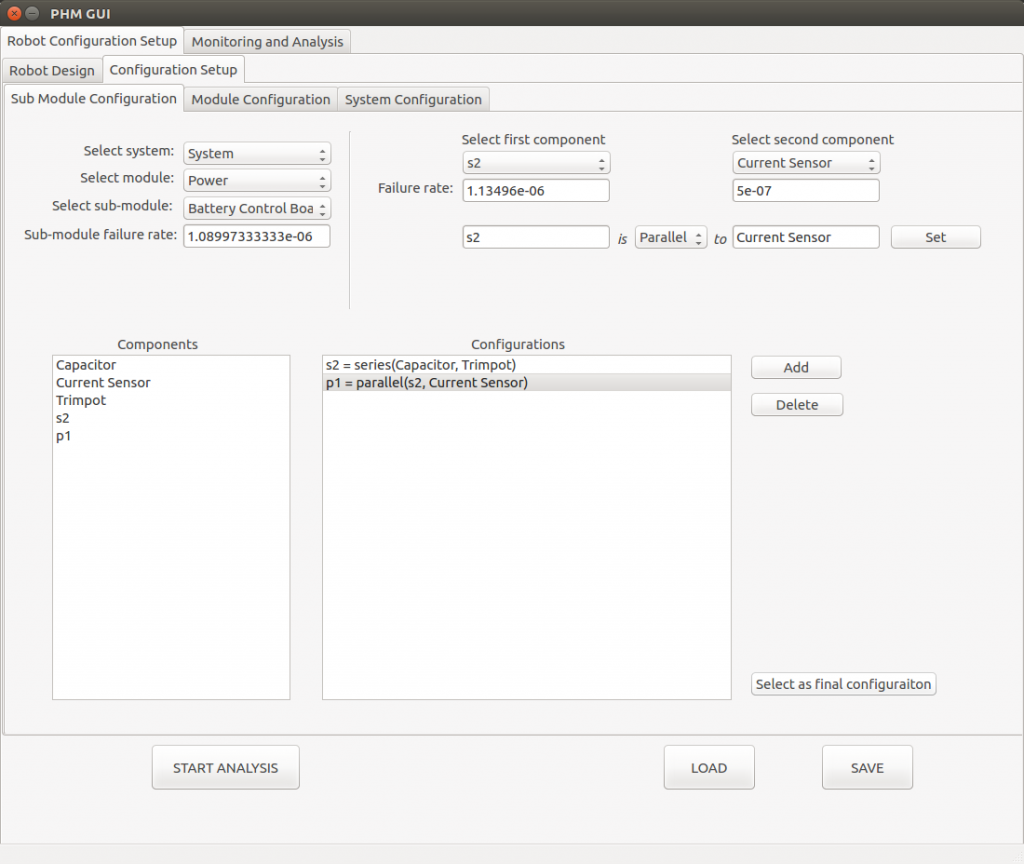
– Fig. 4 Configuration Setup tab in PHM GUI –
The user can save a system he created and configured in this tab, or load a system he previously saved to PHM Tool. Saving and loading operations are performed by using the “Save” and “Load” buttons on the “Robot Configuration Setup” tab.
The system is configured in the “System Configuration” tab and when the “Start Analysis” button is clicked, the hazard rate values of the system and its subcomponents are calculated. The calculated hazard rate value of the system is shown in real time graph in the “Hazard Rate Analysis” tab according to the time. By adding module-based sensors, the user can calculate the hazard rate values as sensor based and see them as real time graphics (Figure 5).
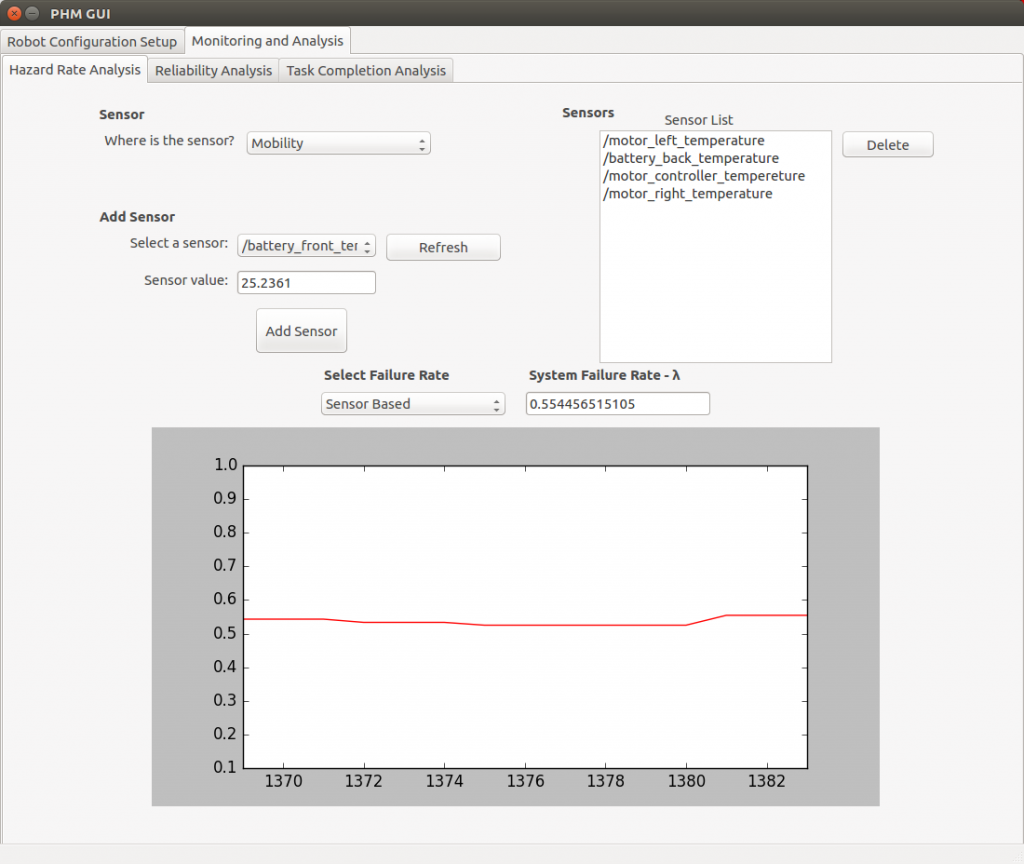
– Fig. 5 Hazard Rate Analysis in PHM GUI and real time graphics –
After the hazard rate value is calculated, the reliability values are calculated according to the selected reliability model and unit. The calculated system reliability value is shown in real time graph on the “Reliability Analysis” tab. In addition, this tab shows the reliability values of the modules in the system. If the user added sensors to the module, the sensor-based reliability value can also be seen on the interface (Figure 6).
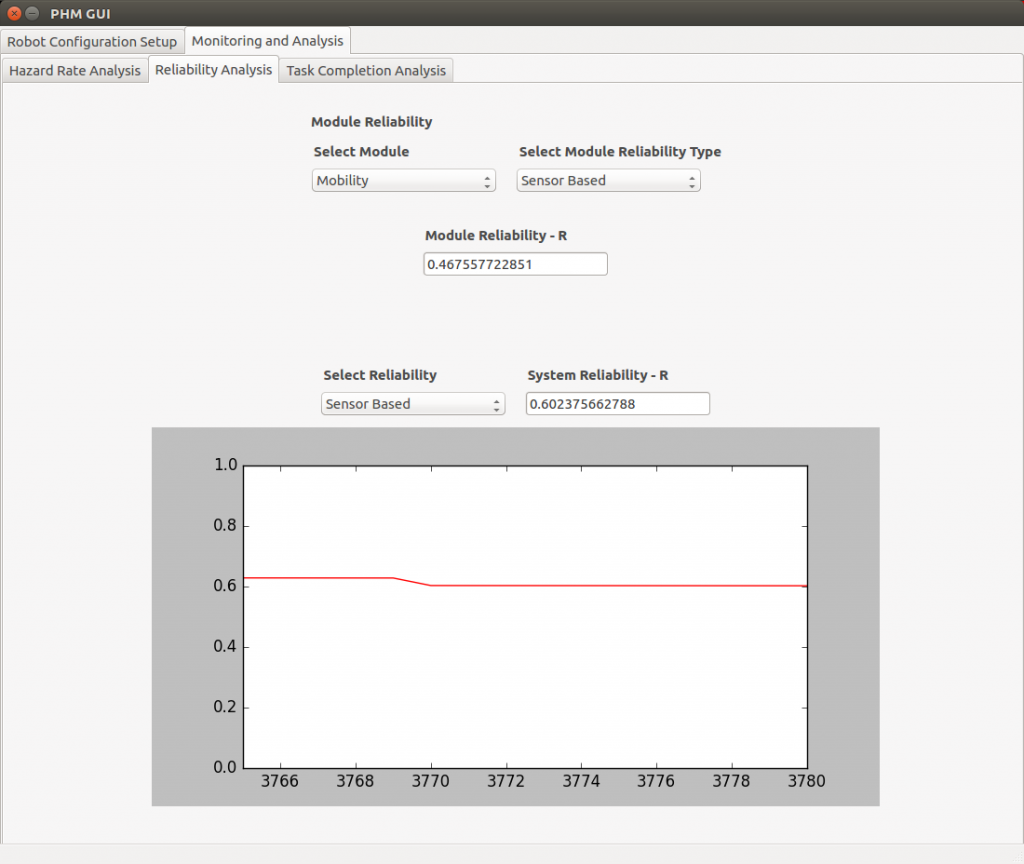
– Fig. 6 Reliability Analysis in PHM GUI and real time graphics –
Depending on the reliability model and unit chosen by the user, the reliability value is started to be calculated. There are two requirements to calculate the value of the Probability of Task Completion (POTC): First one is that the reliability value should be calculated and the second one is that the robot must have received a task to complete. There are also 2 methods to calculate the POTC value. These are “Real time analysis” (Figure 7) and “Prognostic analysis” (Figure 8).
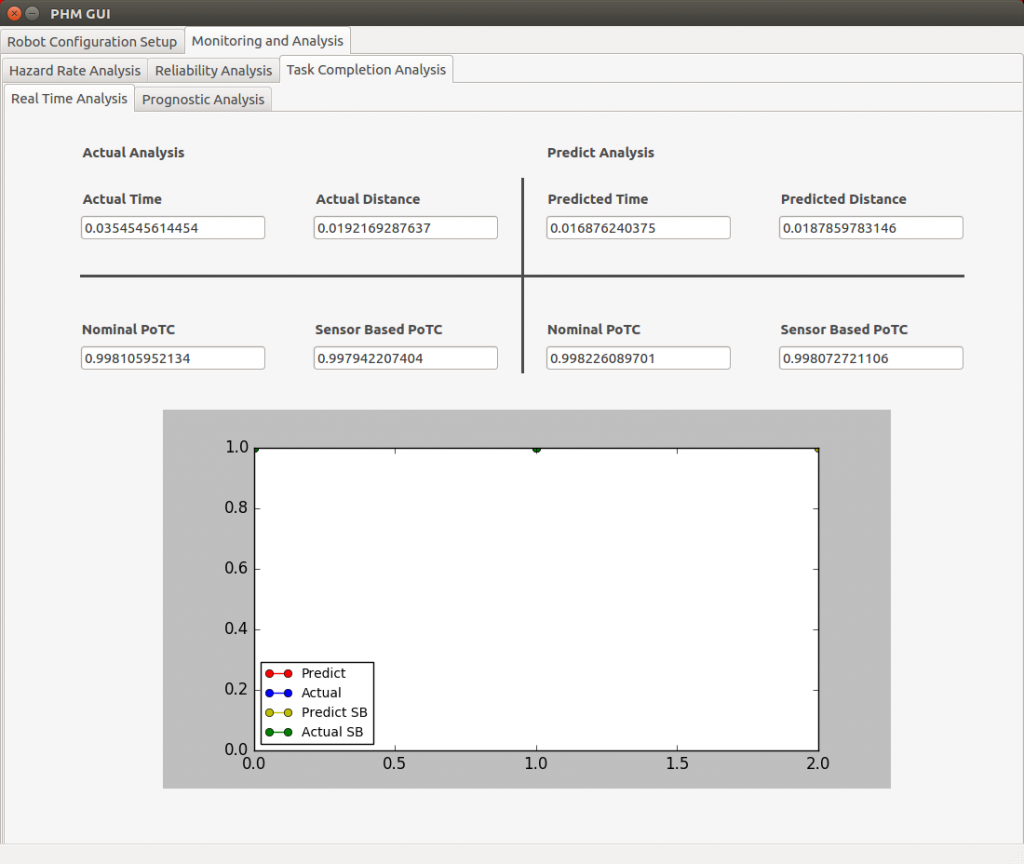
– Fig. 7 Real time task completion analysis in PHM GUI –
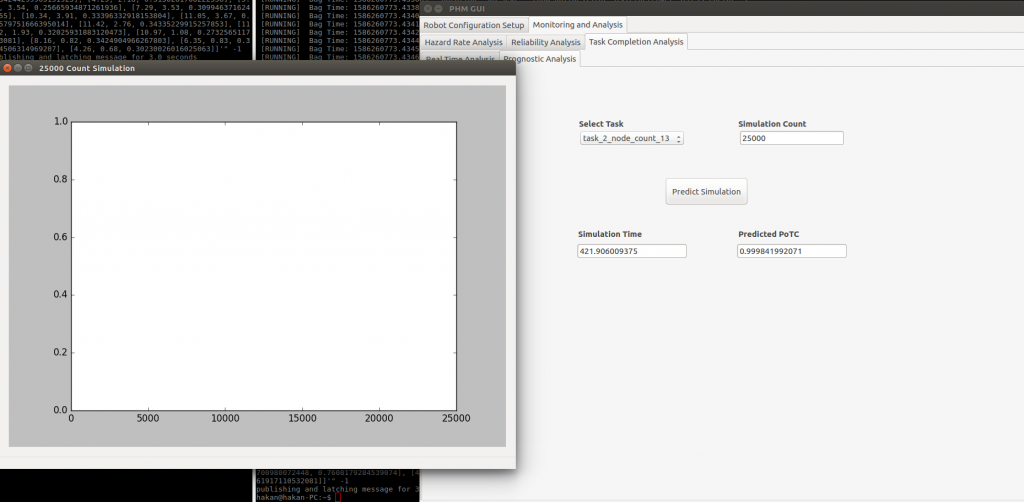
– Fig. 8 Prognostic analysis in PHM GUI –
Application of PHM Tool in a Mobile Robot
Main steps done in PHM tool mobile robot use-case scenario are ;
- Robot design with PHM tool
- Robot configuration
- Data acquisition from Mobile Robot
- Hazard Rate analysis in real time
- Reliability analysis in real time
- Task completion analysis
In this use-case, firstly data acquisition system is developed and instrumented to the OTA. With this DAQ system, sensory data is gathered from OTA and recorded to the bag files. Various sensors on OTA are gathered to analyze the effect of the data from the environment (temperature, humidity, vibration, voltage, current etc.) on OTA. Data from these sensors are published from ROS topics and subscribed to these topics via the PHM Tool to calculate the impact of sensor data on system failure rate and reliability.
After that, PHM tool is used for designing and configuring the OTA for reliability and probability of task completion analysis. For this purpose, reliability and nominal hazard rate data of components are taken from the developed mobile robot (OTA).
Additionally, usage time of components are measured from given missions and system architecture (series or parallel) are configured by the user. Updated hazard rate is calculated with the knowledge of all above.
Since PHM Tool is a modular tool, each of the modules, submodules and components in OTA must be added in this tool. OTA design is done by adding modules, submodules and components in PHM Tool.
OTA should be configured by making physical arrangements of these added parts according to each other. As a result of the design and configuration of OTA in the PHM Tool, the hazard rate and failure rate values of the system are calculated. As an example, the failure rate of mechanical bearings is significantly affected by operating conditions such as temperature, rotational speed, and load. In this scenario, the updated hazard rate is be extrapolated over a range of temperature and nominal conditions by using simulation and recorded data. GAZEBOsim is used for task completion analysis and SMACH tool is used as finite state machine for controlling high-level behavior of OTA.
The work done in the use case scenario for mobile robot is shown in the YouToube videos below. This work is done in real time.
Mobile Robot Design in PHM Tool
Mobile Robot Configuration in PHM Tool
Data Acquisition for PHM Tool from sensors and Analysis
For the details:
https://github.com/inomuh/phm_tools
For the tutorials of PHM Tool:
http://wiki.ros.org/phm_tools/Tutorials
Bildquellen
- PHM_4_ROS_Logo_2: Bildrechte beim Autor